Gallery 2 - Digital GIS Maps and Illustrations
The following screen captures show various examples of cave and karst GIS mapping and visualization. The descriptions include details on data sources and techniques used to create the images.
Click the thumbnail to view a larger image. All maps and images by: B. W. Szukalski.
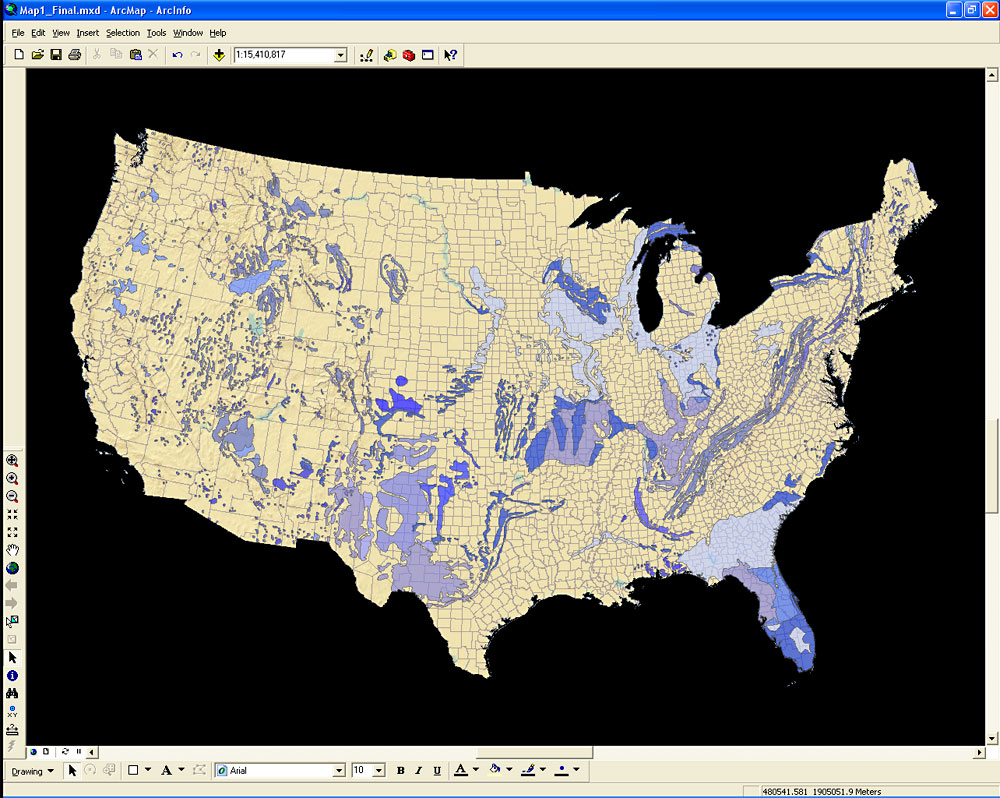
KARST MAP OF THE UNITED STATES
This map shows the distribution of karst within the United States and is based upon GIS data obtained from the USGS Digital Engineering Aspects of Karst Map : A GIS version of Davies, W.E., Simpson, J.H., Ohlmacher, G.C., Kirk, W.S., and Newton, E.G., 1984, Engineering aspects of karst, U.S. Geological Survey, National Atlas of the United States of America, scale 1:7,5000. by Bret D. Tobin and David J. Weary, U.S. Geological Survey Open-File Report 2004-1352
The karst shapefile is shown drawn atop the World Shaded Relief Web service from ESRI's ArcGIS Online, and also includes the US county boundaries obtained from the ESRI Data & Maps collection. The karst layer has been shaded on the karst type description, and uses partial transparency.
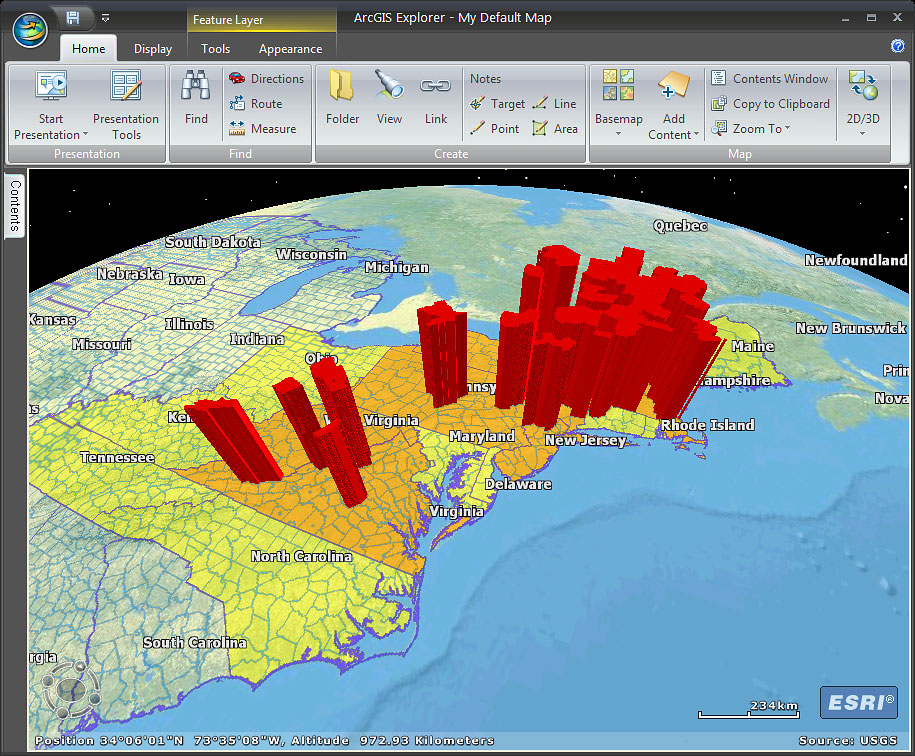
WHITE NOSE SYNDROME (WNS) APRIL 2009
White Nose Syndrome (WNS) has been devastating bat populations in caves along the east coast, and threatens to spread to adjacent states. This ArcGIS Explorer visualization shows counties of confirmed or suspected cases extruded, affected states highlighted in orange, and states where voluntary caving moratoriums apply shown in yellow.
The data was obtained from a map prepared by Cal Butchkoski of the Pennsylvania Game Commission. ArcGIS Explorer, a free geobrowser from ESRI, is used for visualizing the data.
For the latest WNS information visit the National Speleological Society (NSS) WNS Web site.
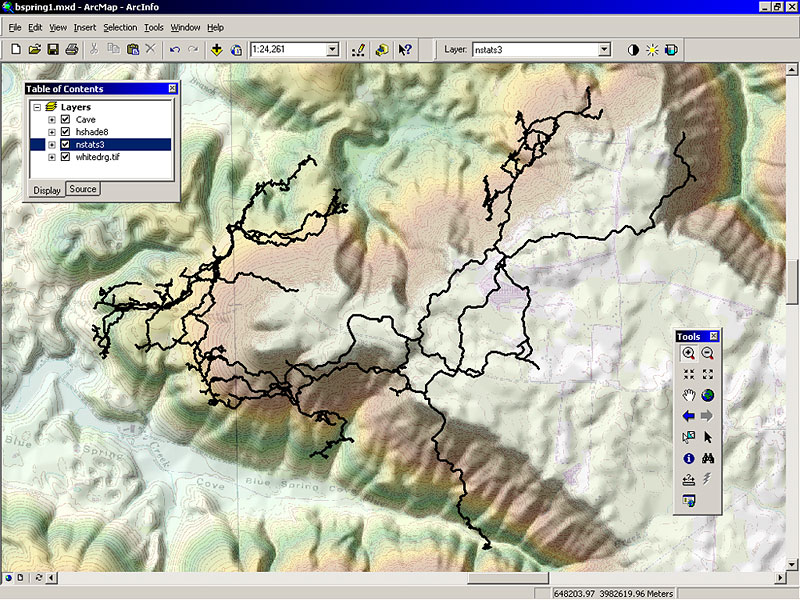
CAVE LINEPLOT DRAPE WITH DEM, DRG, HILLSHADE
Cave survey lineplot data from a Tennessee cave, stored and managed using Compass, was exported to shapefile format directly from Compass. The underlying basemap was created by generating an elevation grid from the USGS DEM of the area and deriving hillshade and shaded elevation rasters. The DRG was also obtained from the USGS and added as another map layer. Transparency for all layers was adjusted to create the final basemap.
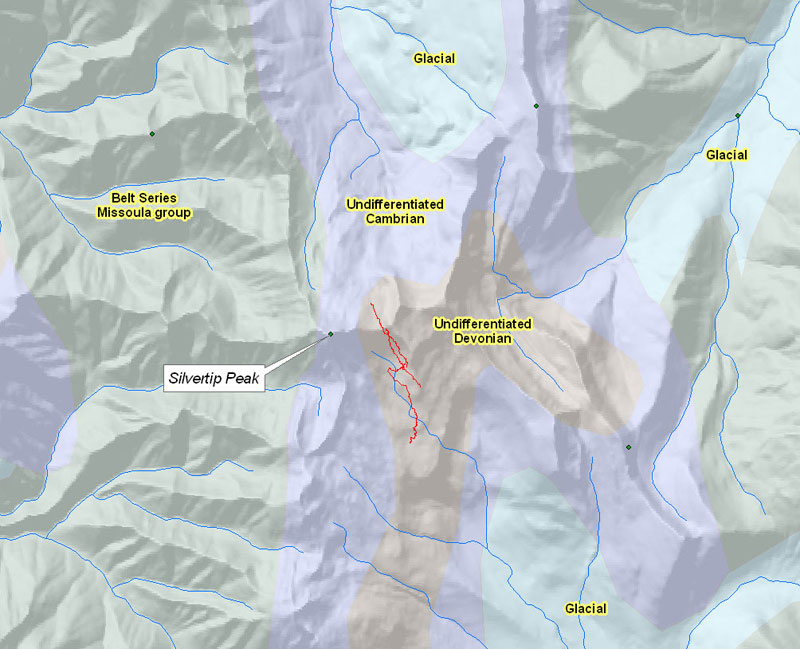
CAVE LINEPLOT, TERRAIN, AND GENERALIZED GEOLOGY
This is a "quick and easy" map showing generalized geology and a cave survey overlay. The underlying DEM and geologic map were obtained from the Montana State GIS Clearinghouse. A hillshade was generated from the DEM using ArcGIS 3D Analyst, and the geologic map was shaded with partial transparency. Labels for geologic formations were automatically generated by specifying the attribute from which the labels should be created using the ArcGIS layer properties.